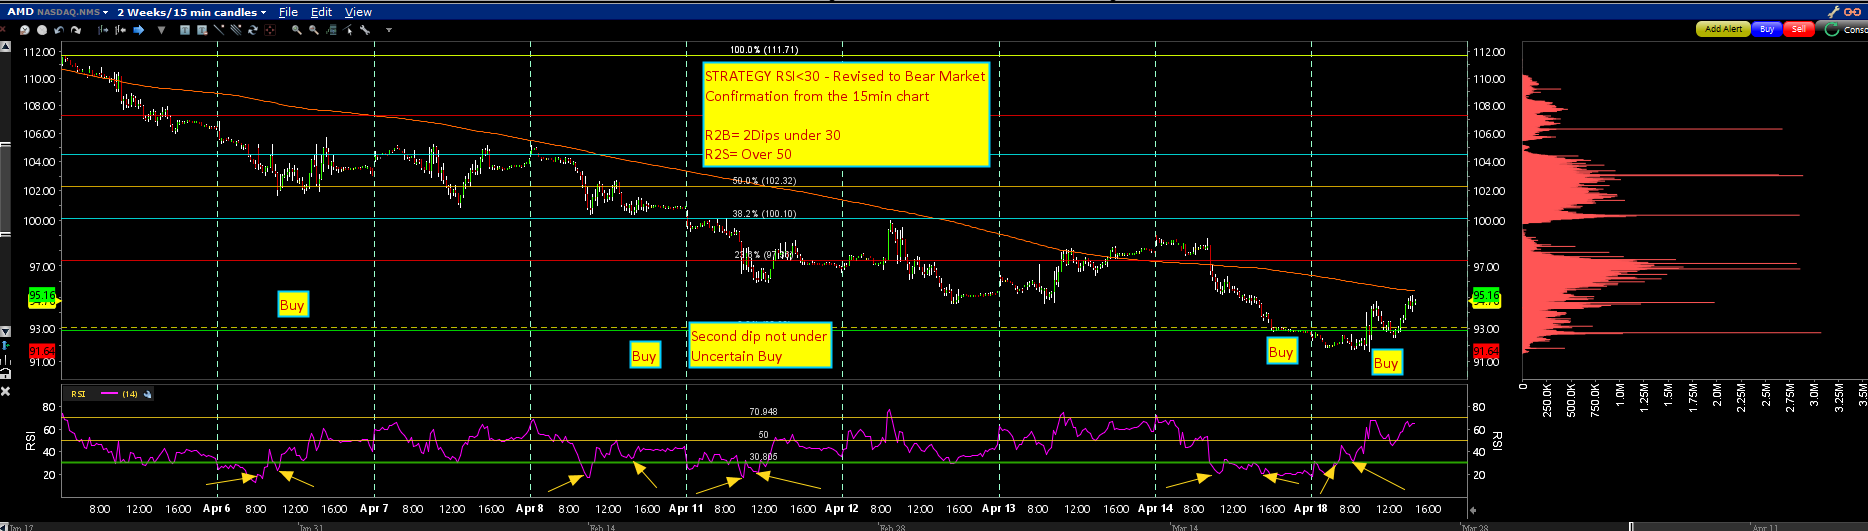
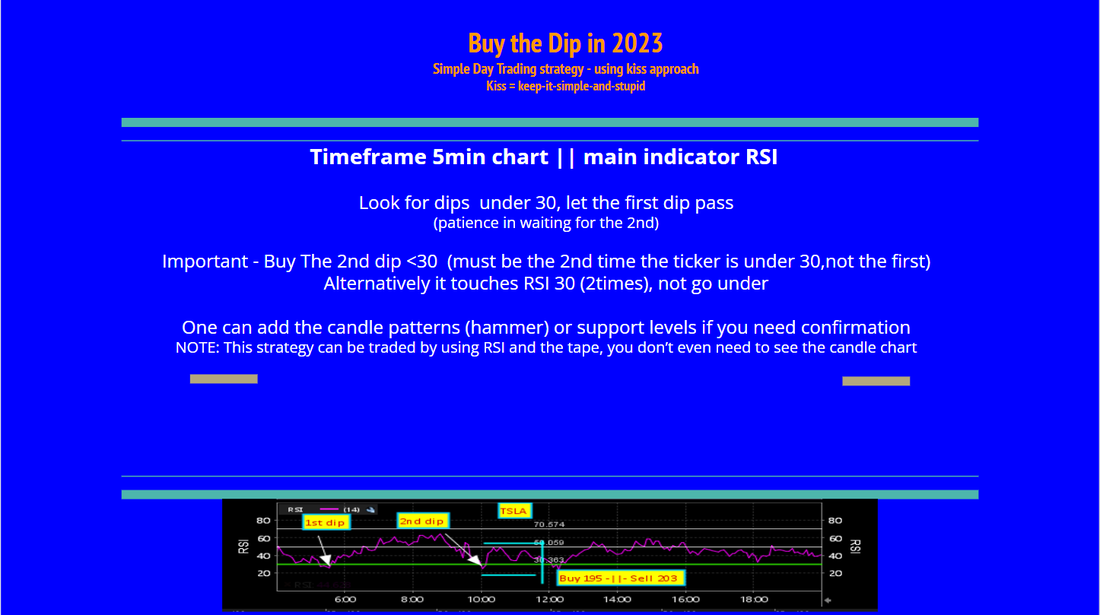
SUCCESS RATE with this RSI <30 Strategy is ~55%. This is regardless of Bull/Bear Market conditions I have revised the strategy during from earlier days Modifications include: Use 15min Chart - and 30min chart Main time frame to trade from is the 5min chart= Dip - RSI<30 - before entering
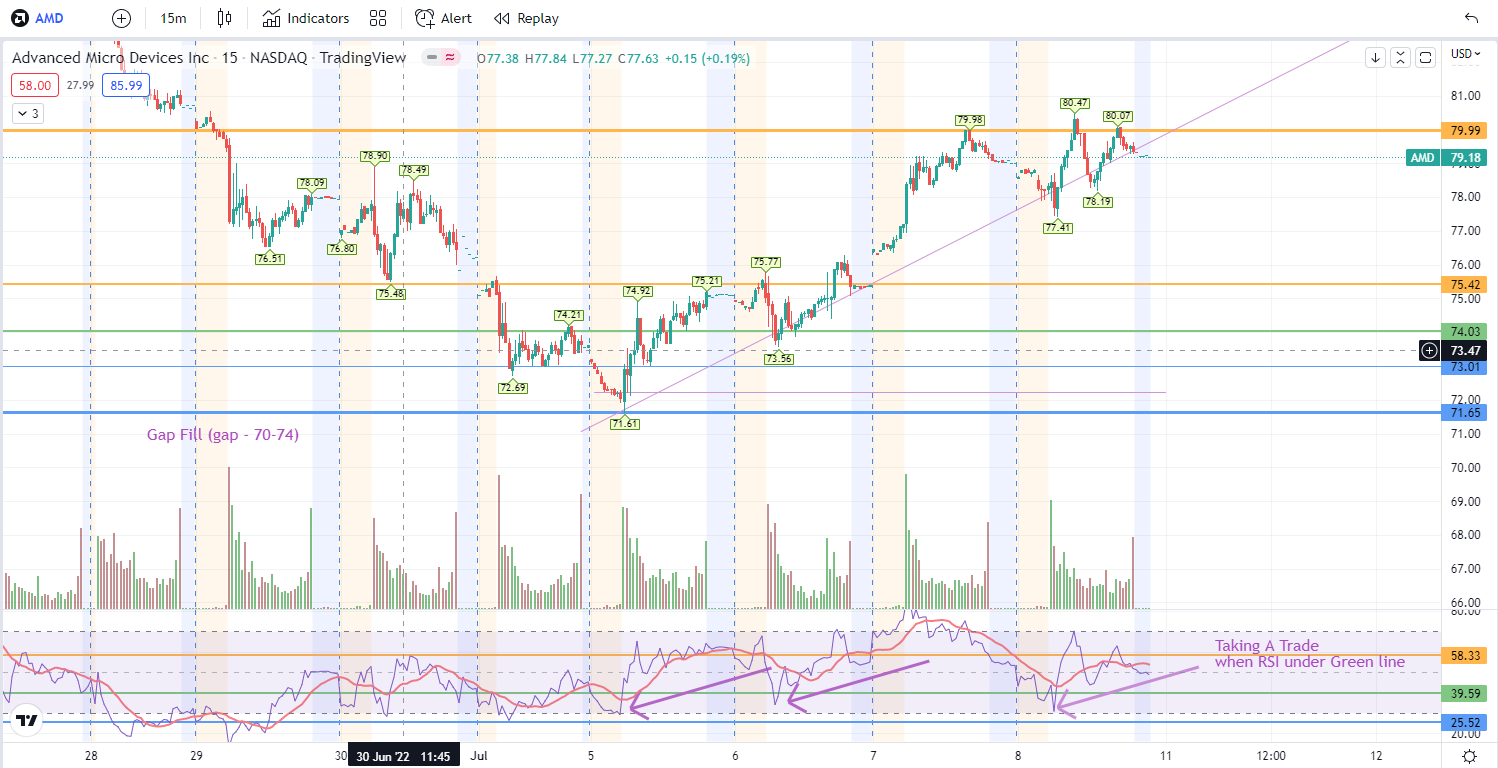
RSI = The concept/indicator is based on oversold/overbought. The theory is more than 100 years old. You might think that the world has changed so much that this principle cannot possibly work. I can assure you it does work. Before entering any Trade, I check from the 2 weeks - 15min chart, what is the RSI (14 period) value. If it's under 30 and + 5 min chart confirms that the selling is done = 2x RSI< 30 - I enter. The combination of: -RSI (14 period) on 2weeks/15min chart, the value should be 30 or under -15min chart shows a Volume shelf as support -5 min chart Exhausting Volume -5min chart Camarilla support levels (S1 - S5) -5min chart RSI (9 period) shows a Dip or Double Dip ( RSI<30 x 2) -5min Candle signal = Hammer, Double bottom, multiple touches at support (not too much focus on candles) -2min Chart shows a reversal pattern -The Market is supporting your move
15min Chart - The KEY is - RSI (14 period) < 30. The rest supports your decision. 15min Chart - If RSI is under 40-50 - it's a more higher Risk Trade, but with a Double Dip on the 5min chart, it can work
TIP: When you see Camarilla levels and Fibonacci levels match at the same ballpark. It has stronger support than usual.
Everybody has their own way of doing things. I like the KISS strategy KISS = Keep It Simple and Stupid RSI = Relative Strength Index NOTE: I only Trade the Long in all market conditions, trade bounces from support (No shorting).